Cleveland's subsurface tells a story of ancient glaciers and a massive prehistoric lake. When you're breaking ground near the Cuyahoga River or on the thick lacustrine clays of the Lake Erie plain, standard borings often miss what lies between the holes. That's where seismic tomography fills the gap. The glacial stratigraphy here is deceptive—dense tills can mask soft lenses of lakebed clay, and shale bedrock depth can vary by 20 feet across a single city block. A seismic refraction survey maps these transitions continuously, giving you a velocity profile that reveals hardpan rippability and hidden soft zones before the excavators arrive. For deeper targets or bedrock mapping below 100 feet, reflection tomography images the shale contact with resolution that drilling alone cannot achieve. We've run these methods from the Flats to the Heights, and the subsurface never looks the same twice.
Tomographic inversion maps what lies between borings—critical in Cleveland's erratic glacial deposits where soft clay lenses hide within dense till.
Scope of work in Cleveland
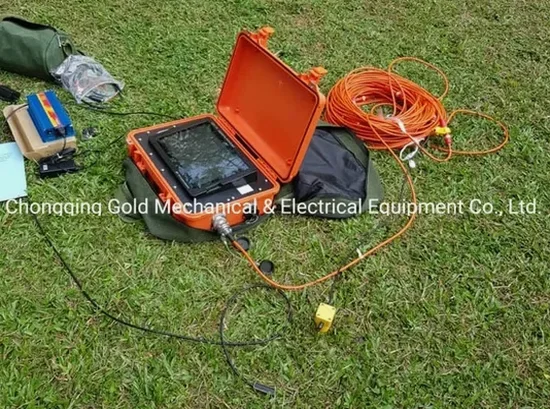
Typical technical challenges in Cleveland
The glacial history of the Cleveland area deposited a chaotic sequence: stiff Wisconsinan till, soft lacustrine silts from ancient Lake Erie, and outwash sands that can carry groundwater under artesian pressure. We've seen projects in the Flats where bedrock was mapped at 30 feet on one side of the lot and 55 feet on the other—a 25-foot differential that changed the entire foundation strategy from spread footings to driven piles. Seismic tomography catches these transitions before you're committed to a design assumption. Another risk is the weathered shale zone. The Chagrin Shale decomposes into a stiff clay that feels like rock to a drill rig but has less than half the bearing capacity. Velocity analysis distinguishes competent shale (above 8,000 ft/s) from weathered material (2,500-4,500 ft/s). On brownfield sites near the steel mills, fill thickness is highly variable and often contains slag, brick, and buried foundations that scatter seismic energy. We map these anomalies and flag them for targeted test pit excavation.
Our services
Our seismic tomography services in Cleveland cover the full range of site investigation needs, from shallow utility corridors to deep bedrock mapping for heavy structures.
P-Wave Refraction Tomography
2D profiling of compressional wave velocity for mapping depth to bedrock, rippability assessment, and identifying buried channels in the glacial drift. Ideal for building sites and road alignments across the Lake Erie plain.
S-Wave Crosshole and Downhole
Direct measurement of shear wave velocity profiles for seismic site classification per ASCE 7. We combine with refraction lines to extend the Vs model between boreholes, reducing the number of borings needed.
High-Resolution Reflection Tomography
For deep bedrock mapping (150-400 feet) and delineating fracture zones within the shale and sandstone sequence. Used on bridge pier locations and heavy industrial foundations where deep competence matters.
Quick answers
What is the typical cost of a seismic tomography survey in Cleveland?
Seismic tomography surveys in the Cleveland area generally range from $2,910 to $5,280 USD depending on the line length, number of spreads, and whether both P-wave and S-wave data are acquired. A single 230-foot refraction line with P-wave only falls at the lower end, while a multi-line survey with reflection tomography and MASW for site classification reaches the upper range. We provide a firm quote after reviewing your site plan and target depth requirements.
How does seismic tomography compare to drilling boreholes for a Cleveland site?
Drilling gives you a point measurement at the hole location. Seismic tomography gives you a continuous 2D cross-section between widely spaced points. In Cleveland's glacial deposits, where lenses of soft clay can exist between stiff till layers, a borehole might miss a compressible zone entirely. Tomography measures the velocity contrast that reveals these hidden features. The best practice combines both: boreholes for sample recovery and tomographic lines to tie the stratigraphy between them.
Can seismic refraction determine rippability of the Chagrin Shale?
Yes, and this is a common application on Cleveland construction sites. The Caterpillar rippability chart correlates seismic P-wave velocity to whether shale can be excavated by a D8 or D9 dozer versus requiring hammering or blasting. Competent Chagrin Shale typically shows velocities above 7,500 ft/s, which falls into the marginal-to-blasting range. Weathered shale at 3,000-4,500 ft/s is rippable. We deliver velocity contour maps that the excavation contractor can use directly for equipment planning and cost estimating.